Dentists will slow down on antibiotics if you show them a chart of their prescribing numbers.
Antimicrobial resistance is a serious public health concern. PLOS Medicine has published findings from an RCT studying whether quantitative feedback and intervention about prescribing patterns will reduce dentists’ antibiotic RXs. An intervention group prescribed substantially fewer antibiotics per 100 cases.
Insight: historical data ➞ influence ➞ dentist antibiotic prescribing rates
The Evidence. Peer-reviewed: An Audit and Feedback Intervention for Reducing Antibiotic Prescribing in General Dental Practice.
Data: Collected using RAPiD Cluster Randomised Controlled Trial, and analyzed with ANCOVA.
This study evaluated the impact of providing general-practice dentists with individualised feedback consisting of a line graph of their monthly antibiotic prescribing rate. Rates in the intervention group were substantially lower than in the control group.
From the authors: “The feedback provided in this study is a relatively straightforward, low-cost public health and patient safety intervention that could potentially help the entire healthcare profession address the increasing challenge of antimicrobial resistance.” Authors: Paula Elouafkaoui et al.
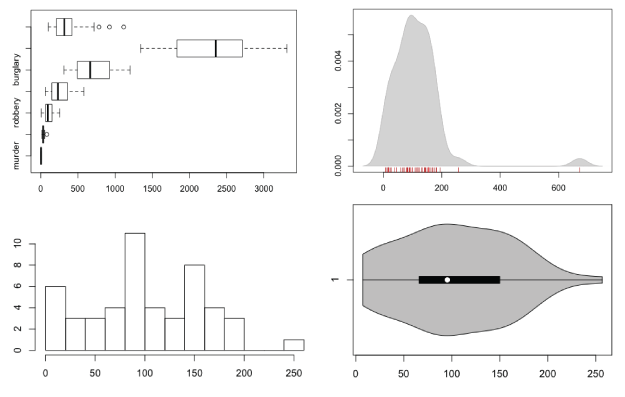 2. Visualizing data distributions.
Nathan Yau’s fantastic blog, Flowing Data, offers a simple explanation of distributions – the spread of a dataset – and how to compare them. Highly recommended. “Single data points from a large dataset can make it more relatable, but those individual numbers don’t mean much without something to compare to. That’s where distributions come in.”
3. Calculating ‘expected value’ of health interventions.
Frank David provides a useful reminder of the realities of computing ‘expected value’. Sooner or later, we must make simplifying assumptions, and compare costs and benefits on similar terms (usually $). On Forbes he walks us through a straightforward calculation of the value of an Epi-pen. (Frank’s firm, Pharmagellan, is coming out with a book on biotech financial modeling, and we look forward to that.)

4. What is Bayesian, really?
In the Three Faces of Bayes, @burrsettles beautifully describes three uses of the term Bayesian, and wonders “Why is it that Bayesian networks, for example, aren’t considered… y’know… Bayesian?” Recommended for readers wanting to know more about these algorithms for machine learning and decision analysis.
Fun Fact: Everyone can stop carrying around fake babies. Evidence tells us baby simulators don’t deter teen pregnancy after all.
Posted by Tracy Allison Altman on 9-Sept-2016.